Debugging is a critical skill that every programmer needs to become better at their jobs. Visual Studio provides several windows that help make debugging easier, but until now I hadn't really used them all that often. Well, in the spirit of not caring that I suck as long as I'm learning, I did a little research into the debugger windows that I'd never truly used before, and compiled a list of the most useful debugger windows in Visual Studio 2015. Here's hoping this helps some other debugging newbie as much as it has helped me.
We will cover the following windows in this post:
Without further ado, let's get started!
Breakpoints
Shortcut: Ctrl + Alt + B
The Breakpoints window is the simplest of the debugger windows; it just lists all the breakpoints in your application, and bolds those that are currently active. From this window, you can enable or disable specific breakpoints (by checking/unchecking them in the list), delete breakpoints, or edit their settings.

Output
Shortcut: Ctrl + Alt + O
The Output window displays status messages from the IDE. This window is basically the talkative younger cousin to the other windows; it spouts everything it has ever heard, and occasionally you'll hear something that interests you. It's the most verbose of the debugger windows, but if you need to really dig deep to find the bug you're looking for, it is invaluable.

Diagnostic Tools
Shortcut: Ctrl + Alt + F2
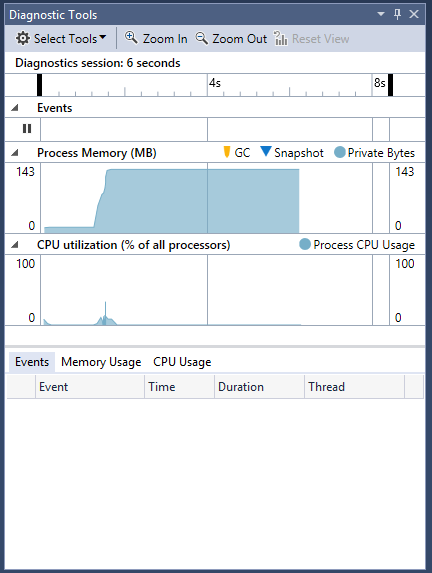
New in Visual Studio 2015 is the Diagnostic Tools window. This handy window allows you to monitor and analyze performance data even as you are debugging, and IMHO is a truly useful addition to the Visual Studio IDE.

The Diagnostic Tools window displays the following information:
- Events: Displays the time information related to breakpoint- and stepping-enabled events.
- Process Memory: A graph showing the memory being used by the process over time.
- CPU Utilization: A graph showing the CPU utilization over time (note that the unit is "% of all processors")
Autos
Shortcut: Ctrl + Alt + V, A
The Autos window shows the variables used in the current line of code and the preceding line of code of a set Breakpoint, listing their current values. This is a quick way to view the nearby state of the application at the set breakpoint. If you are only concerned about the immediate vicinity of the line being executed, the Autos window will show you all the current values.

Locals
Shortcut: Ctrl + Alt + V, L
The Locals window displays the variables (and their values) that are local to the current context or scope. Generally this means the procedure or function you are currently debugging. Both the Locals and Autos windows are populated automatically by Visual Studio's debugger.

Immediate
Shortcut: Ctrl + Alt + I
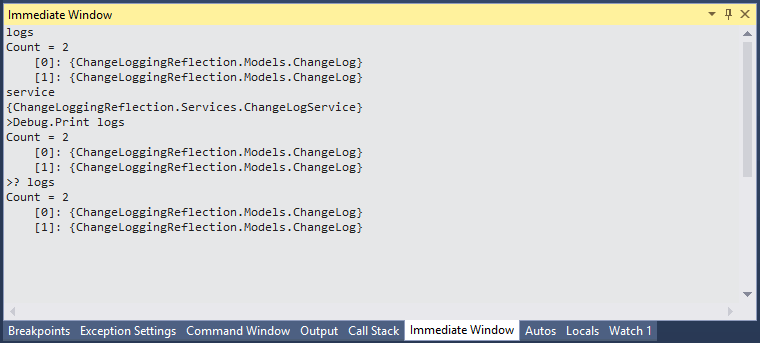
The Immediate window, like Locals and Autos, is used to debug the values of properties and expressions. However, unlike those windows, the Immediate window is not automatically populated; it only shows value for properties and expressions that you enter into it. More importantly, the Immediate window can evaluate expressions using a command-like syntax, three examples of which are included in the screenshot below.
The Immediate window gives you more fine-grain control over what expressions or value you'd like to view at a given point in the execution, but you have to populate it manually.

Watch
Shortcut: Ctrl + Alt + W, 1 or Ctrl + Alt + W, 2 or Ctrl + Alt + W, 3 or Ctrl + Alt + W, 4
The Watch window allows you to watch values entered into it. This means that you could track the value of that particular variable throughout the execution of your method. Even better, you can track more than just variables; you can track any expression recognized by the debugger. If you're trying to find out what happened to your variable or object, and need to know where and when it changed, this window will help you find out. Visual Studio 2015 allows you to have up to 4 Watch windows open at a time (hence the multiple shortcuts).
Because the values in the Watch window are persistent, they remain in the window even if they're no longer in current execution scope. Here's the window with variables that are in scope:

And here is the window with those same two variables, except that now the execution has moved beyond the appropriate scope:

Call Stack
Shortcut: Ctrl + Alt + C
The Call Stack window simply displays each method or function that is currently on the stack. This is very useful if you are trying to track down which method called the method that contains the current line of code. Even more useful is the fact that this window will also display the language that each item on the stack was written in, so those of you working in multiple-language environments will get extra usage out of this window.

Exception Settings
Shortcut: Ctrl + Alt + E
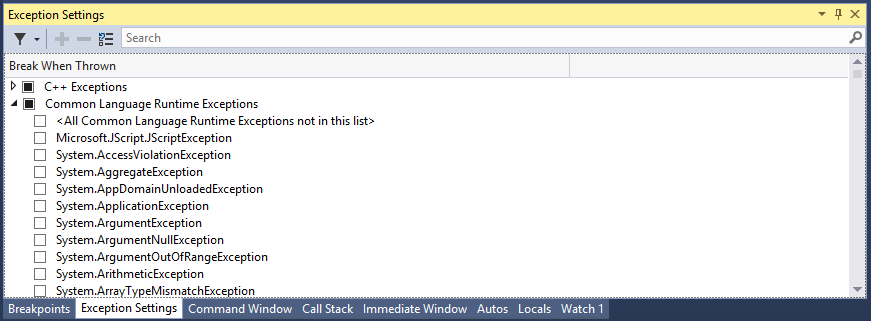
The Exception Settings window allows you to specify which exceptions will cause the debugger to break, and where they should break. For example, you could specify that the debugger only break on ArgumentNullExceptions, or JavaScript OutOfMemory exceptions, or nothing at all (which I don't recommend, but you could do it). If you need fine-grain control over what exceptions do and do not cause the debugger to break, this window has you covered.

Summary
These are the debugger windows in Visual Studio that I believe are the most useful. Now that I more thoroughly understand what each of these windows are meant to be used for, I will certainly be utilizing them more often. Hopefully, you will too.
Did I miss any debugger windows in Visual Studio 2015 that you use? Do you have another purpose for one of the windows listed? Share in the comments!
Happy Debugging!


